Overview #
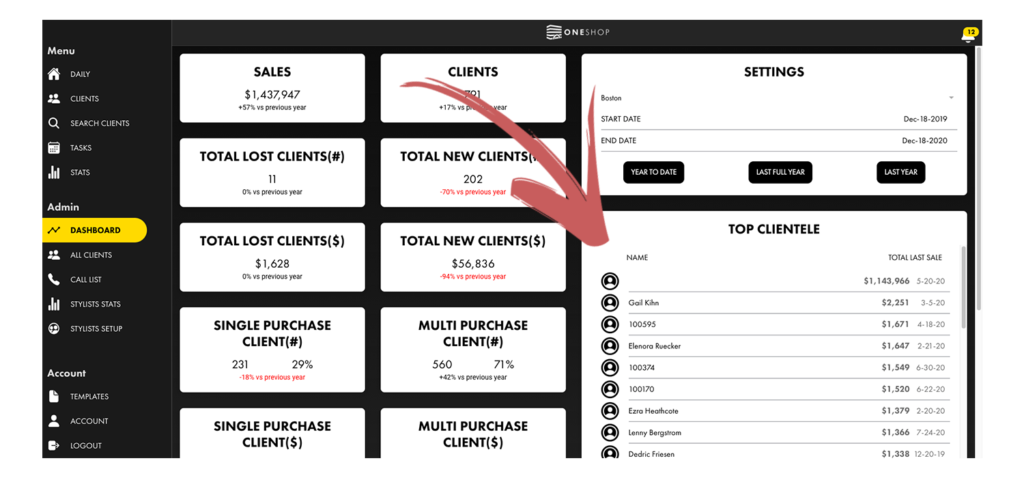
On the admin dashboard you are able to see the stats across all your stores and the breakdown of your clienteling metrics that you can impact to drive increased sales over the year.
Choosing a Date Range #
This dashboard is completely flexible, and you are able to filter the results by all stores, a single location, and date range.
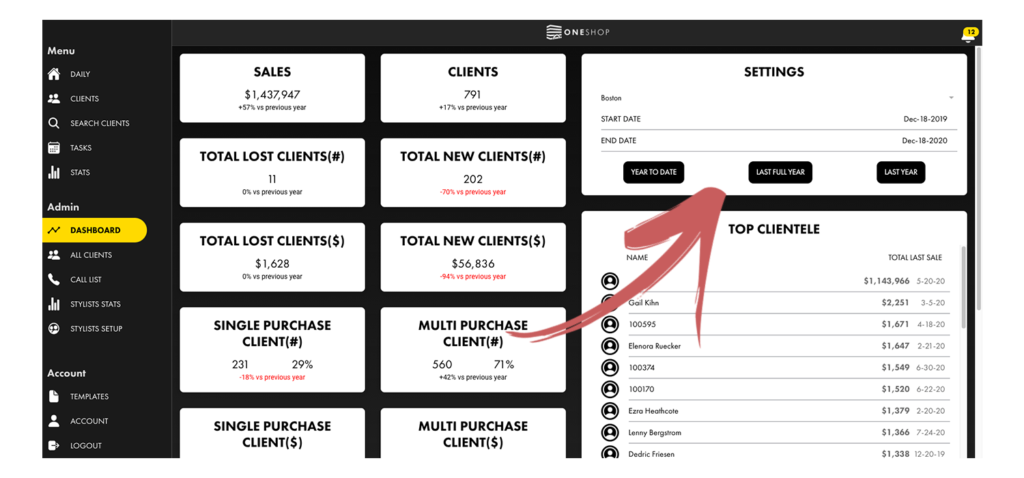
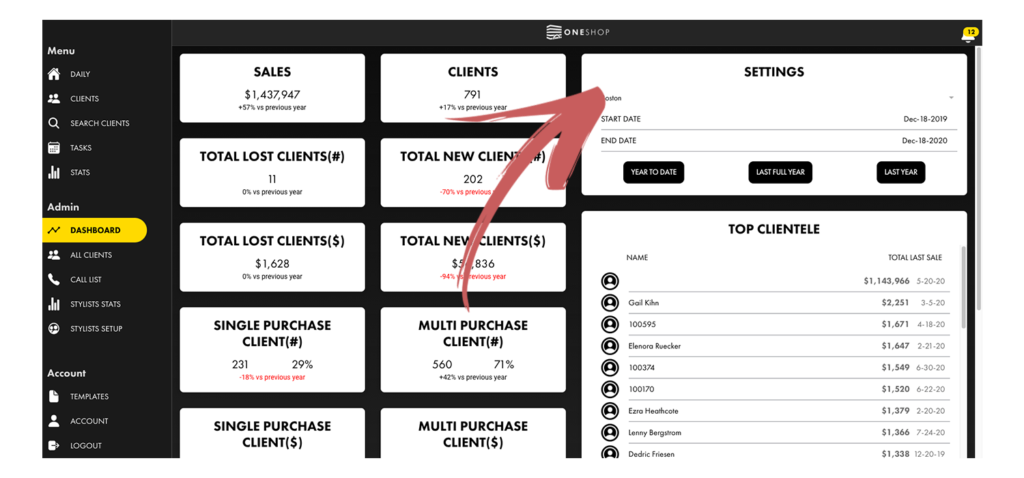
To change the location simply hit the store location bar at the top of the settings section.
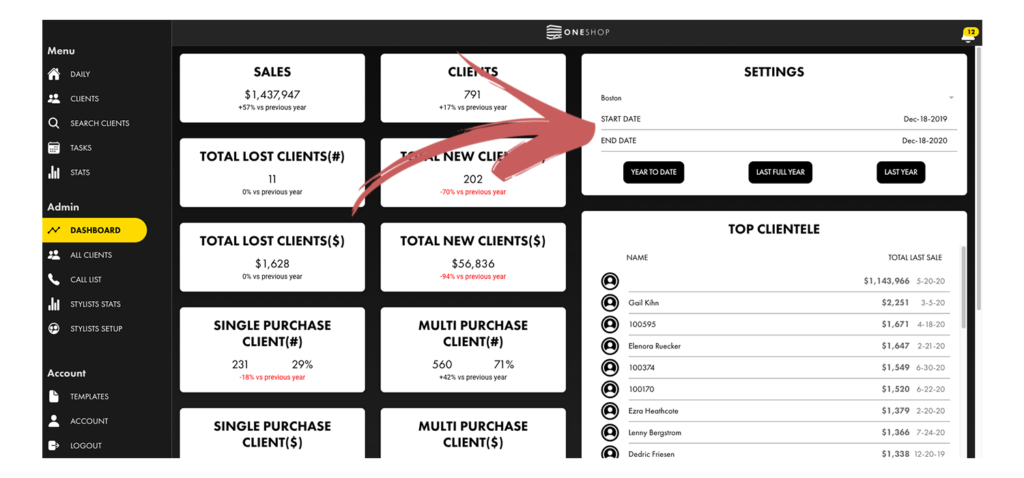
If you want to change the date range, choose custom dates in the date selector or use the shortcut buttons beneath it.
Data Sections #
Once you have your date range selected, the data will automatically calculate to reflect the date range that you have selected.
Each data point reflected on this dashboard is pivotal to understand the opportunity your store has to increase the engagement with your core customers or revive customers that have not shopped in awhile.
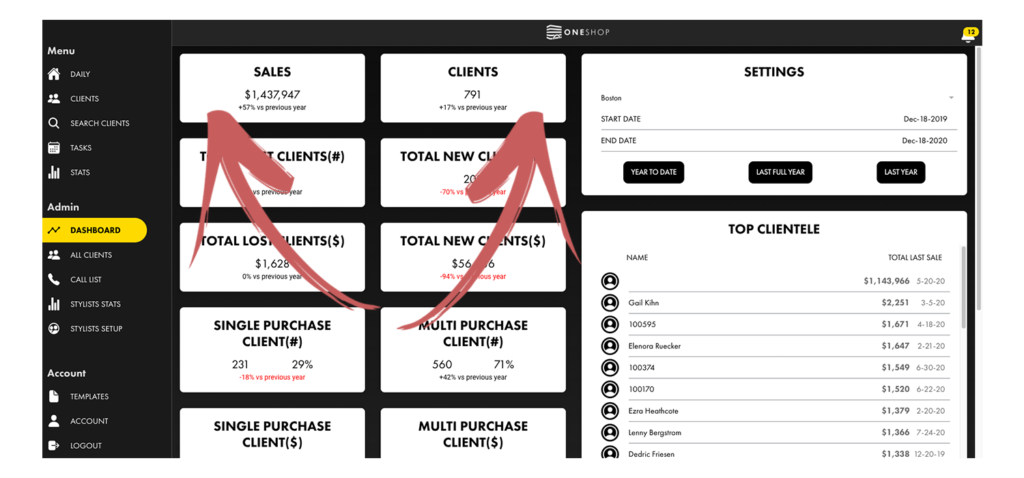
Sales and Clients #
The sales and clients section will show the sales and number of clients that purchased in the date range that you have selected.
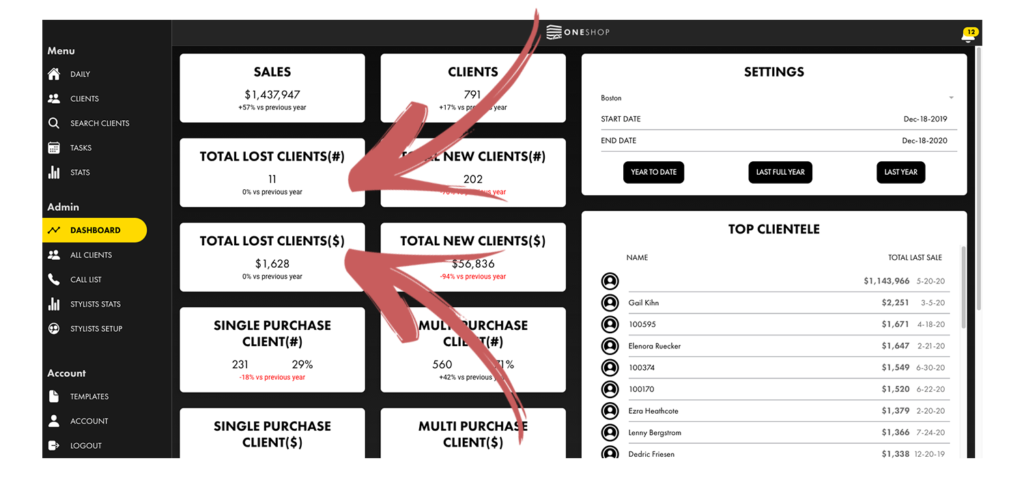
Total Lost Clients #
This section addresses your “lost” clients, which is the terminology we use to identify clients that you did not shop in the period you selected that shopped in the period before. So for example if you have the last 12 months selected, it will identify the number of customers that shopped with you 12-24 months ago that did not shop again in the last 12 months.
We know lost is not truly accurate (we believe a customer is never truly lost!) so if you have a better terminology suggestion, please let us know!
In the dashboard, we identify these both by the number of customers as well as the amount that they spent in the period before.
You can see these labeled by the “#” and “$” symbols.
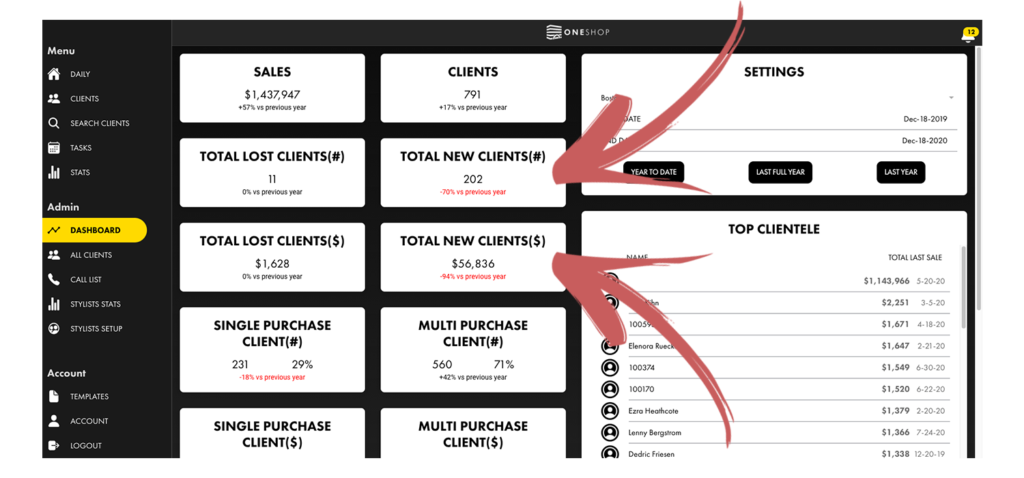
New Clients #
Like lost clients, new clients is also defined by number and by the dollar amount that they spent.
New clients are defined as any client that shopped in the time period you have set that has not purchased with you before that time period.
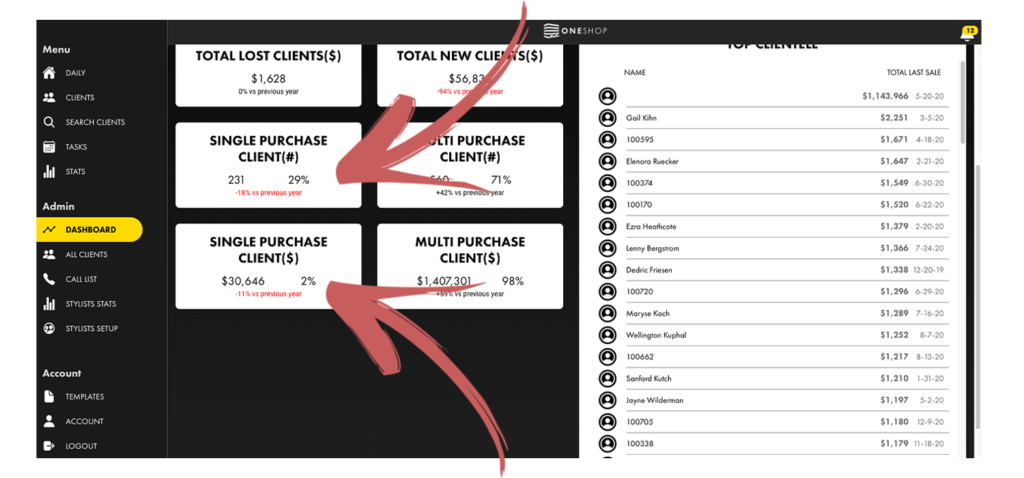
Single Purchase Client #
The single purchase client field is any client that only bought one time in the date range you have selected.
Like the other fields this is shown both in the number of clients that only bought one time as well as the dollars that they spent.
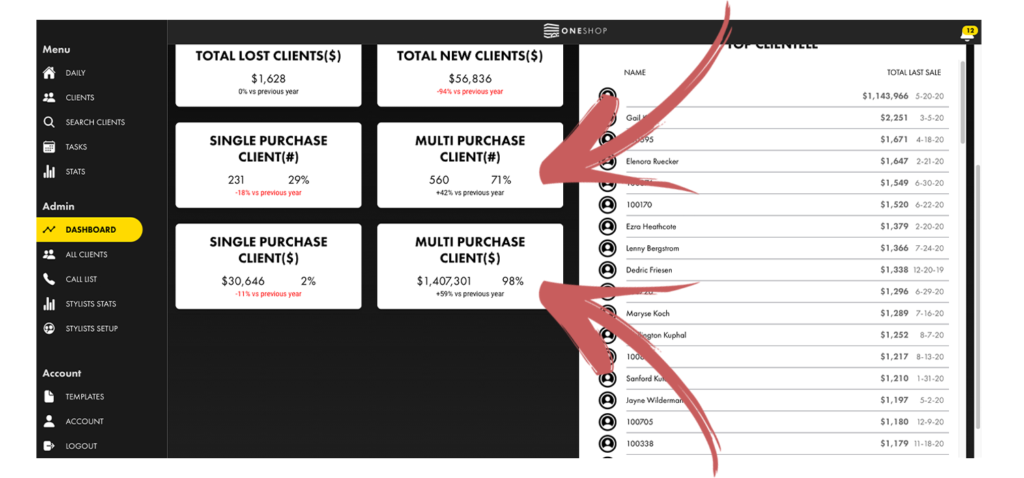
Multi Purchase Clients #
The multi purchase numbers show the amount of clients that purchased more than one time in the date range that you selected.
Once again this is shown as both the number of clients that purchased multiple times as well as the dollars that they spent.
Top Clients #
This section will show the top clients from descending purchase volume (top to bottom) for the time period that you selected.
What to Take Away #
As we all know, numbers are only valuable if an action plan is taken away from them.
SO.
What should you take away from these numbers?
Simply stated…. RATIOS.
The ratio between these numbers are everything and show where the opportunities lie in your business.
If your lost clients # and/or dollar amount is vastly higher than the amount of new clients you bringing in, you are essentially losing sales every year so either need to re-engage your lost customers or increase your new customers to off set it.
The ratio between single customers and multi customers also shows where you can focus your business – answers the question – how are you doing creating recurring purchases?
It is best to check on these numbers every month or quarter to see where your business is trending.